


Today is book launch day for Canary in a Climate World (paperback, hardcover, Kindle), and it is already the #1 new release in Environmental Science at Amazon!

As you may recall, I published my chapter, Losing My Religion, two months ago:

The day after I posted that piece, I had the honor of attending a presentation by Gregory Wrightstone, who was then executive director of the CO₂ Coalition and is now a senior fellow and whose paradigm-shifting research I cited in my chapter.
Since Gregory is a fellow contributor to Canary in a Climate World, this seems like the perfect time to share his presentation with you.
Author of Inconvenient Facts: The Science That Al Gore Doesn’t Want You to Know and A Very Convenient Warming: How Modest Warming and More CO₂ Are Benefiting Humanity, Gregory has a wonderfully uplifting, scientifically-backed message for us all: There is no climate crisis, and we can thank moderately rising CO₂ levels for saving us from the brink of extinction!
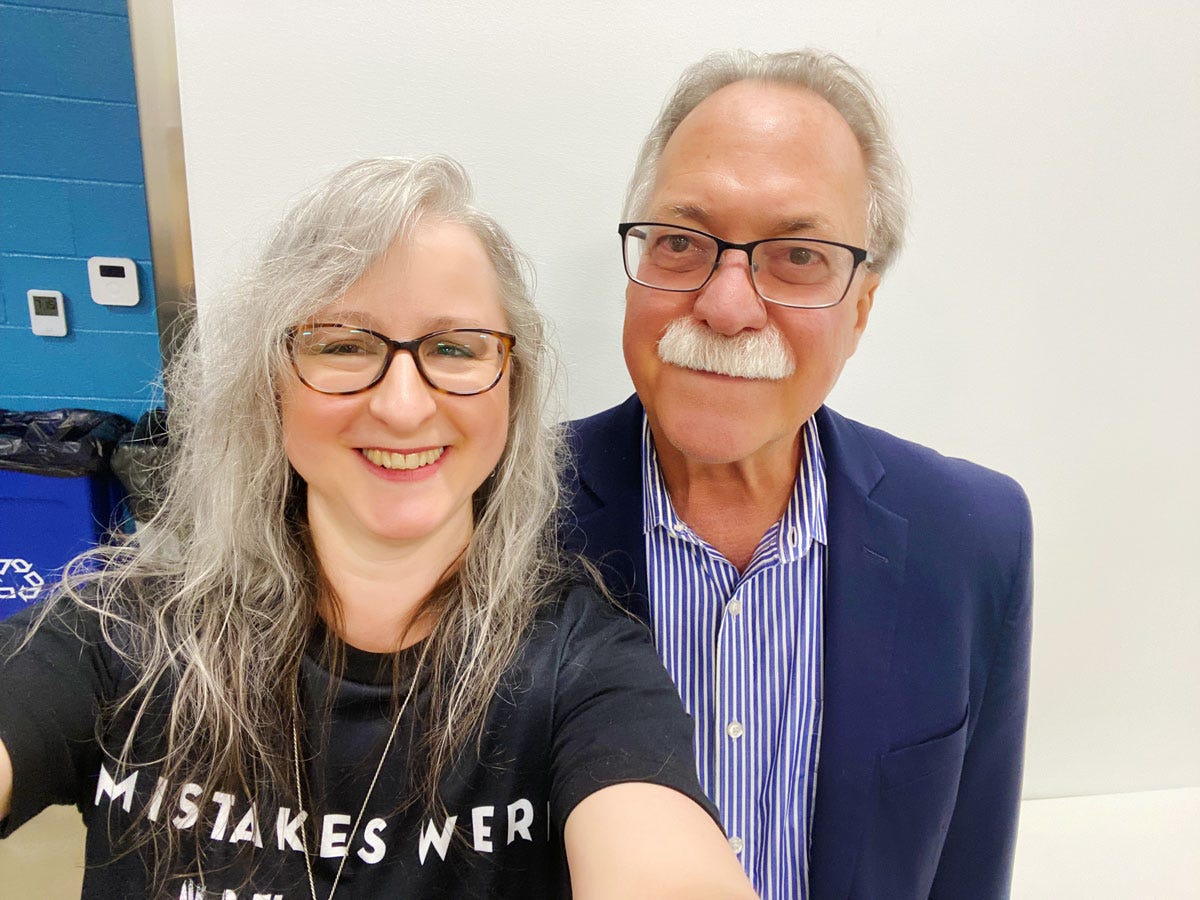

If you’re wondering what that really means and how the scientific evidence has led Gregory and many of his esteemed CO₂ Coalition colleagues to that conclusion, then this presentation is for you—and anyone who is intellectually curious and open to learning more about how climate science has been contorted into political science to create climate alarmism in service of a dubious agenda.

I hope you will find Gregory’s research as informative and exciting as I do. Please spread the good news that life is good and getting better!
Gregory Wrightstone Presentation
March 27, 2026 (Medford, Oregon)
[Video begins with an off-screen introduction (not included in the transcript) by John Schleining, who hosted Gregory’s visit to Oregon.]
I will say it’s an honor to count John Schleining as a friend. He’s a singularly great man with a big heart. We all owe John a big debt of gratitude. I don’t have to tell you that. He’s a great man.
The underlying story today—a lot of you have my first book, Inconvenient Facts. That was generated—as a geologist, I knew some of what we were being told about climate change was incorrect. I suspected other things were. So I did a deep dive into climate change and the science and found out that we were being lied to about a lot of it. So this was actually my personal search for the truth that led to the first book to conclude there’s no climate crisis.
Here, we go a little bit further that not only is there not a climate crisis, but Earth’s ecosystems are thriving and prospering by almost every metric we looked at, and humanity’s benefiting.
Life is good in Oregon, the United States, and globally and getting better. That’s the takeaway tonight.
So the CO₂ Coalition, we’re more than 200 of the top scientists in the world. That includes, Patrick Moore. He was a cofounder of Greenpeace, and he found that they had lost their way. He was a true environmentalist. He was on those Zodiac boats where they went to the whales being killed. He had harpoons shot over his Zodiac boat. He was early, but then Greenpeace lost their way. And he left, and now he sits on our board.
Dr. John Clauser, Nobel Laureate in Physics, 2022, sits on our board.
And the gentleman to the bottom left, Dr. William Happer. I think a lot of you know Will Wilkinson. Will has written a biography of Dr. Happer. He’s the chairman and founder of the CO₂ Coalition. His life story needed telling, and I recruited Will to tell it. It’s just amazing what the man has done. He’s a true blend of humility, wisdom, intellect, and it’s great to work with him almost on a daily basis.
What’s happening right now is the Endangerment finding. In 2007, the Supreme Court determined, it was called Massachusetts vs. EPA, they determined in 2007 that CO₂ was a pollutant and it could be regulated. The next year, the Obama EPA issued what was called the Endangerment Finding that indeed started regulating CO₂. That’s what’s led to all this, everything that you know.
When I tell you I’m pro-choice, I am proudly pro-choice, but I’m not pro-choice how you usually hear it. I’m pro-choice in that you all should have the choice of what kind of appliance to buy. And you don’t have everything in your home. If you look around you, your washing machine, your dryer, everything is what the government tells you you’re allowed to buy. So if you go buy a dishwasher today, it takes two and a half to four hours to cycle.
And they call that highly efficient because it’s using very little energy, very little water, and it doesn’t get your dishes clean. My wife’s definition of efficiency is a lot different than the government’s. Her definition of an efficient dishwasher is one that will get your dishes clean in forty-five minutes or less and dry. And so they’ve used this to control almost every aspect of our lives was this Endangerment Finding because they say CO₂ is a pollutant.
A month ago, Lee Zeldin, who’s the administrator of the EPA, announced that they were repealing the endangerment finding. We applaud it. Later that same day, fifteen environmental companies, or a coalition of them, filed an appeal of the repeal and said, “No.” So it’s going to go to the DC Circuit Court.
We had thirty days, and we’ve elected to take a big step, the CO₂ Coalition, on Friday, we’re filing to get us to oppose that. And it’s expensive, it’s really, really expensive. We’ve gotten the best attorneys in DC, very accomplished, but it’s almost as if this is why the CO₂ Coalition was created for a moment just like this. I told our board, we voted on it. It was a lot of money we’re spending that we don’t really have. And I said, “If not us, who? If not now, when?”
This is why we have to do this. And it was almost as if we’re created for this moment. We intervened.
This is our intervention document. And all of this is driven because this notion that CO₂, carbon dioxide, is the demon molecule. We call it the miracle molecule, and we see that it has huge benefits, which we’ll learn about tonight. And so a lot of this material was taken from the book that a lot of you bought already, if you haven’t, ten bucks, half price.
So again, climate crisis, what climate crisis? We have a billboard campaign we’ve had across—this was on from the Pennsylvania turnpike. Heads were exploding as people were driving by. We did it in Salt Lake City, and we’d like to do it, I think it would look really great here in Medford, Oregon. So it’s not that expensive.
So you’ve heard about the consensus. “There’s a 97-percent consensus of the scientists that agree that CO₂ is driving temperatures up and it’s leading to horrible consequences.”
Michael Crichton famously said, “There’s no such thing as consensus science. If it’s consensus, it isn’t science. If it’s science, it isn’t consensus.”
But my favorite quote is Dr. Richard Feynman, again, Nobel Prize winner in Physics, just a great man. He said, “I would rather have questions that can’t be answered than answers that can’t be questioned.”
That’s what we have today. We have people, we have good science saying, “No, you’re wrong, but we’re silenced completely.”
That dam I think is breaking now with the Trump administration. We’re seeing more and more every day. I say all the time, we are winning, bigly.
So in the current climate debate, what do we agree with? There’s some things we agree with. CO₂ is increasing. Nearly all of the CO₂ increase is from us burning fossil fuels for the most part. And temperature has risen about a degree and a half Celsius since the beginning of the Industrial Revolution.
But there’s serious disagreement. Why is the temperature rising? They say it’s CO₂ is a control knob. We say it’s mostly naturally driven. And is the increase of CO₂ and temperature harmful or beneficial? That’s what we’ll go through tonight.
We look first at carbon dioxide through time. It’s important. We started measuring detailed CO₂ at Mauna Loa Observatory in 1958. We’ve seen a steady increase of carbon dioxide. When you look at this, just to set you up, if it’s blue, it’s carbon dioxide, and it’ll always be oldest on the left, youngest on the right. If it’s red that you see, it’ll be temperature.
You can see we started increasing CO₂ a lot in the middle of the twentieth century in the post–World War II economic boom. So if you see any temperature driven by CO₂, it’ll start in the middle of the twentieth century. So keep your eye on that. And we also know that during these ice advances—we are in an interglacial period that usually lasts 11,000 to 12,000 years. We’re 10,000-plus years into this one. It’s a warming period. During the glacial advances, carbon dioxide decreases significantly. In these warm periods, it increases, but you’ll see our increase is way up here. So something’s different. And the something that’s different is us using fossil fuels. And I’m okay with that.
If we look over the last 140 million years of carbon dioxide data, just a significant decline from 2,500 parts per million to today, it’s a little over 400. Not that long ago, we nearly got to that red line. It’s what I call the Line of Death. It’s 150 parts per million. We were nearly there, and below 150 parts per million, plant life can’t survive, and we were nearly there. We’re not there. So right now, we don’t have too much CO₂, we don’t have enough. And we’ll learn more about that. We’re actually CO₂-impoverished.
There’s a lot of information out there that’s just not so. And some of it’s from people that should be allied with us. There’s a report that Mount Pinatubo put out more CO₂ in its eruption than all of mankind forever, and that’s just not true. In fact, what we see is this blue line at the top is what the model CO₂, what it should have been, but after Pinatubo erupted, atmospheric CO₂ actually dropped. And so there’s discussion, Roy Spencer, one of our members, conjectures that it was because of increased photosynthesis. Of course, as you increase photosynthesis, what happens to CO₂? It gets sucked out of the atmosphere, incorporated in trees and vegetation, and he thinks that the sulfates that were up in the stratosphere for Pinatubo reflected sunlight. So the sunlight could be reflected in from all kinds of angles instead of coming directly from the sun. So it could penetrate deeper into the forest and the jungle. And that’s the only thing we can figure out, but it definitely had a decrease.
It’s interesting. I’m a climate geek, but I find this kind of stuff fascinating. The other thing that’s fascinating, too, the blue line at the top here, the solid blue line is the cumulative effect of human emissions. The blue dashed line below is what’s actually showing up in the atmosphere. So we’re emitting twice as much CO₂ as what’s showing up in the atmosphere. Well, how can that be? It is because vegetation is exploding, the greening of the planet, photosynthesis is increasing greatly, and as it does that, it’s sucking CO₂ out of the atmosphere, and it’s leading to increased forest growth, deserts are shrinking, crops are expanding. So it’s interesting, too, that only half of our emissions are showing up in the atmosphere.
Then we hear that CO₂ is driving temperature increases. If you look over the last fifty or eighty years, there has been a correlation between CO₂ in blue and temperature in red. But I’ll caution you, correlation is not causation, and many of you might have seen, there’s a great website called Spurious Correlations. Have any of you seen that? If you go there, they have these wild correlations. For example, there’s a great correlation between ice cream sales and shark attacks.
So what I did here was just I took the Standard and Poor’s stock index in black and compared it to temperature in red. Just to show you there, just because there’s a correlation does not mean it’s causation. So we’ll take a look. It’s important to put it in longer perspective. So we’ll take a look at some other things here.
Remember I said that in the middle of the twentieth century that we started adding a bunch of CO₂ to the atmosphere, and that’s when you should start driving temperature up. Well, again, blue is CO₂, red is temperature. Just as we started adding a lot of CO₂ to the atmosphere, this goes back to 1944 to 1978. Just as we started to put a bunch of CO₂ in the atmosphere, we went into a thirty-three-year cooling event. You’ve probably seen, there’s a lot of YouTube videos of Leonard Nimoy talking about how we’re going into the next Ice Age. And that was in the late seventies.
That was when that stopped. The cooling stopped and started warming up again. But why, if CO₂ is driving temperature, why did it decrease for thirty-three years just as we started?
Then we’ll look a little bit further. This is the longest thermometer-based temperature record we have available. And it goes back to the year 1659. And so again, red is temperature, 1659, 2024, blue is CO₂, and you don’t see much of a correlation.
This is the same graph. I’ve just compressed the Y axis showing temperature and CO₂. Better document that it really doesn’t look like much of a correlation. Last one thousand years of data, again, red is temperature, blue CO₂. In the last warming period, it was at very, very low CO₂ levels, and it was warmer than it is today.
Again, this argues against this idea that CO₂ is driving temperature. And then over 8,000 years of data, we see that there’s been a general decline in temperatures over from 8,000 years to today, all the while CO₂ levels have been increasing. So again, we see all this documentation of a lack of correlation between temperature and CO₂.
Again, they put their blinders on and look in the last fifty years to see it. And they also talk about how glaciers are retreating, “That’s proof of global warming.” Well, this is a summary of 169 glaciers from around the world and shows that glaciers started retreating in the early 1800s. All right. We didn’t start adding a lot of CO₂ until 100-plus years after that. So the glaciers started retreating long before the first Model T rolled off the assembly line.
Glacier retreat predated CO₂. Well, this is my child bride, Julia, and she and I were on a cruise. This is Glacier Bay, Alaska, and we were standing there in front of the John Muir Glacier in Glacier Bay, maybe some of you have been there. And I was standing there, and the captain came on the speaker, and he was lecturing them about climate change, “This is proof of global warming.” And I was redlining because I knew it just is not true.
So I went back and I created this graph. This is Glacier Bay. And for those of you back there, you can’t really see it. So this is the Gulf of Alaska down here. And in the year 1760, there was no Glacier Bay because it was full of ice. All right? This is where it was. 1794 it started retreating. 1845, it was up to here. And so we see that it kept— 90 percent of the retreat of Glacier Bay occurred before 1960, but you never hear that. All they do is say, “See, see, see, global warming. It’s retreating. It’s proof of it.” But again, why was it retreating starting 300, 250 years ago at low CO₂ levels?
I went and I got Oregon data for you specifically because I was coming here, so this should be pretty interesting. And now bear in mind, the data you’re going to see here has been modified by the government a little bit, but we’ve elected to use it. We could have used the raw data, which doesn’t show as much warming, but it’s okay, we’ll just use what they provide. So we use the United States Historic Climate Network data, which is better than a lot of just using all the stations, because some of these stations are just horribly corrupted because they’re next to air conditioning units, they’re in pavement, they’re in airports. And so if you look here, Oregon, average temperature has increased, it’s about one degree Celsius. This goes back, all of the charts you’re going to see go back to 1890 or 1895. So we’ve increased one degree Celsius in what, 100 and—who’s the math genius? I’m a geologist. That’s 130 years. 130 years. We’ve increased one degree of warming over—that doesn’t sound like too much of a crisis to me. But again, blue is CO₂, red temperature.
They’re talking about, well, it’s the hot temperatures that are really getting bad. So here’s Oregon’s average maximum temperature, which usually occurs—typically late afternoon is your maximum temperatures. Not always, but usually it’s late afternoon, maximum temperatures. And we can see here that, again, the maximum temperature has only increased about one degree. So there’s nothing alarming about your maximum temperatures here in Oregon going through the roof.
What else is interesting is your nights are getting warmer. This is Oregon nights with temperatures below 20 degrees Fahrenheit. And what I could have done here was use 32 degrees Fahrenheit for freezing. What this does is show that your Oregon nights, really cold temperatures at night are decreasing. That’s a good thing. That’s really a good thing. What this also does is that tells you that growing seasons are lengthening, killing frosts end earlier in the spring, arrive later in the fall, growing season in the United States, contiguous United States has increased by nearly two weeks since 1900. Think about that.
And you’ve got fruit orchards a lot here in Oregon, don’t you? If you have a fruit orchard, what do you fear the worst? Frost. Late spring killing frost. And because of global warming, those occur much less frequently. That’s a good thing. That’s great for apple orchards and whatever you’ve got growing, all the fruits here, and it’s been a huge benefit. And what we’ll see here going forward is this strong correlation between warming temperatures and more CO₂ driving crop productivity. Those two marching hand in hand are great.
Monday, I started putting the presentation together, updating it, and I got up and in my newsfeed was this headline, “A Once-in-4,433-year Heat Wave Is Hitting the Western United States.”
I went, “Oh my God, I’m going to Medford, Oregon. It’s right in the middle of the worst heat wave in 4,000 years!”
That’s what it showed. It showed Medford in the worst heat wave in 4,000 years. And so I went to AccuWeather, I said, “Wait a minute. The high temperature for Medford, Oregon this week was, well, through Thursday was 72 degrees, the low is 33.” And this is just an example of how they manipulate and frighten you. There’s no heat wave in Medford, Oregon, right now, is there?
But that’s what they want you to believe. Is there a heat wave in other parts of the United States? Yes. But if you’ve been listening to any of this about the heat wave that’s going on now, they always talk about Phoenix, Arizona. Why do they always talk about Phoenix, Arizona? Because of Sky Harbor Airport. It has 15-degrees-Fahrenheit higher temperatures than the surrounding areas because it’s so poorly situated. It’s right by the runway, and it’s often at least 10 degrees and as high as 15 degrees warmer, and that’s why they talk about Phoenix, Arizona. They don’t say that it’s the Sky Harbor Airport Station that they’re reporting. But that’s what they’re telling you. And again, that’s how they lie to you about this and manipulate. And we see this, it’s called the urban heat island effect. We see this throughout the world, Delhi, India, Paris, France, Washington, DC, are some of the worst where we go often 10, 12 degrees more in the urban areas than in the rural areas surrounding it. So be aware of that. And I thought that was pretty funny. I said, “What am I getting into? I’m going to Medford, Oregon. It’s going to be blistering hot.”
Here’s Oregon days with temperatures above 100 degrees Fahrenheit. What do you see? This is the number of days with temperatures above 100, and it’s been pretty much flat. And I would guess that the people in Oregon aren’t being told that. They’re probably being told something completely opposite is my guess.
The other thing that’s been talked about here with this heat wave is the drought in the Western United States. Again, this is Oregon precipitation data. We don’t see any evidence. This data goes back to 1880, actually 1885, whatever, but it’s long-term data showing precipitation. There are wild swings from one year to the other. There’s some years you get a lot of precipitation and some years you don’t. And when you don’t get a lot of precipitation, that’s climate change. When you do get too much precipitation, that’s climate change, too, because they get it both ways. They can call both sides, and they say, “See, climate change.”
But this tells you that overall, precipitation goes up and down, up and down, but there’s no trend one way or the other. And if we look at the Oregon, it’s called the Palmer Drought Severity Index is what we use for determining drought. And we can see again that droughts come, some years are wet, some years there are droughts, but overall there’s not a big trend one way or the other. And we see that globally. And what you’re being asked to do here in Oregon is to make huge changes, to go to net zero, stop producing, using fossil fuels, stop emitting CO₂.
So I looked at this, what would happen if Oregon went to net zero? In other words, if Oregon completely stopped emitting carbon dioxide, well, by the year 2100, you would avert one-thousandth of a degree Fahrenheit by 2100, and that’s what they’re asking you to do. They’re asking you to sacrifice. They’re asking you to give up control. It’s all about control.…
So my next billboard will be, “Global warming saves lives.” (MAA: I was just thinking we need to reframe it.) They say, “You can’t say that!” I can, and I just did, and I’ll prove it.
This was a study, Dr. Antonio Gasparini looked at 74 million temperature-related deaths around the world and found that twenty times as many people die from cold as from heat. And those of you that know graphs, so this was the most recent study. They found that ten times as many people die from cold as from heat. And I looked at this chart, this was the chart, it was in The Lancet, and I looked at the chart and I said, “Something doesn’t look right.” I looked at it very closely, and so those of you that know charts know that what they did was the X axis here was 0 to 250 and then the heat, it was 0 to 50. So what they did was X, by five times they multiplied the heat-related deaths. So I redid it, and so this is what the chart on the right, that’s what it should have looked like.
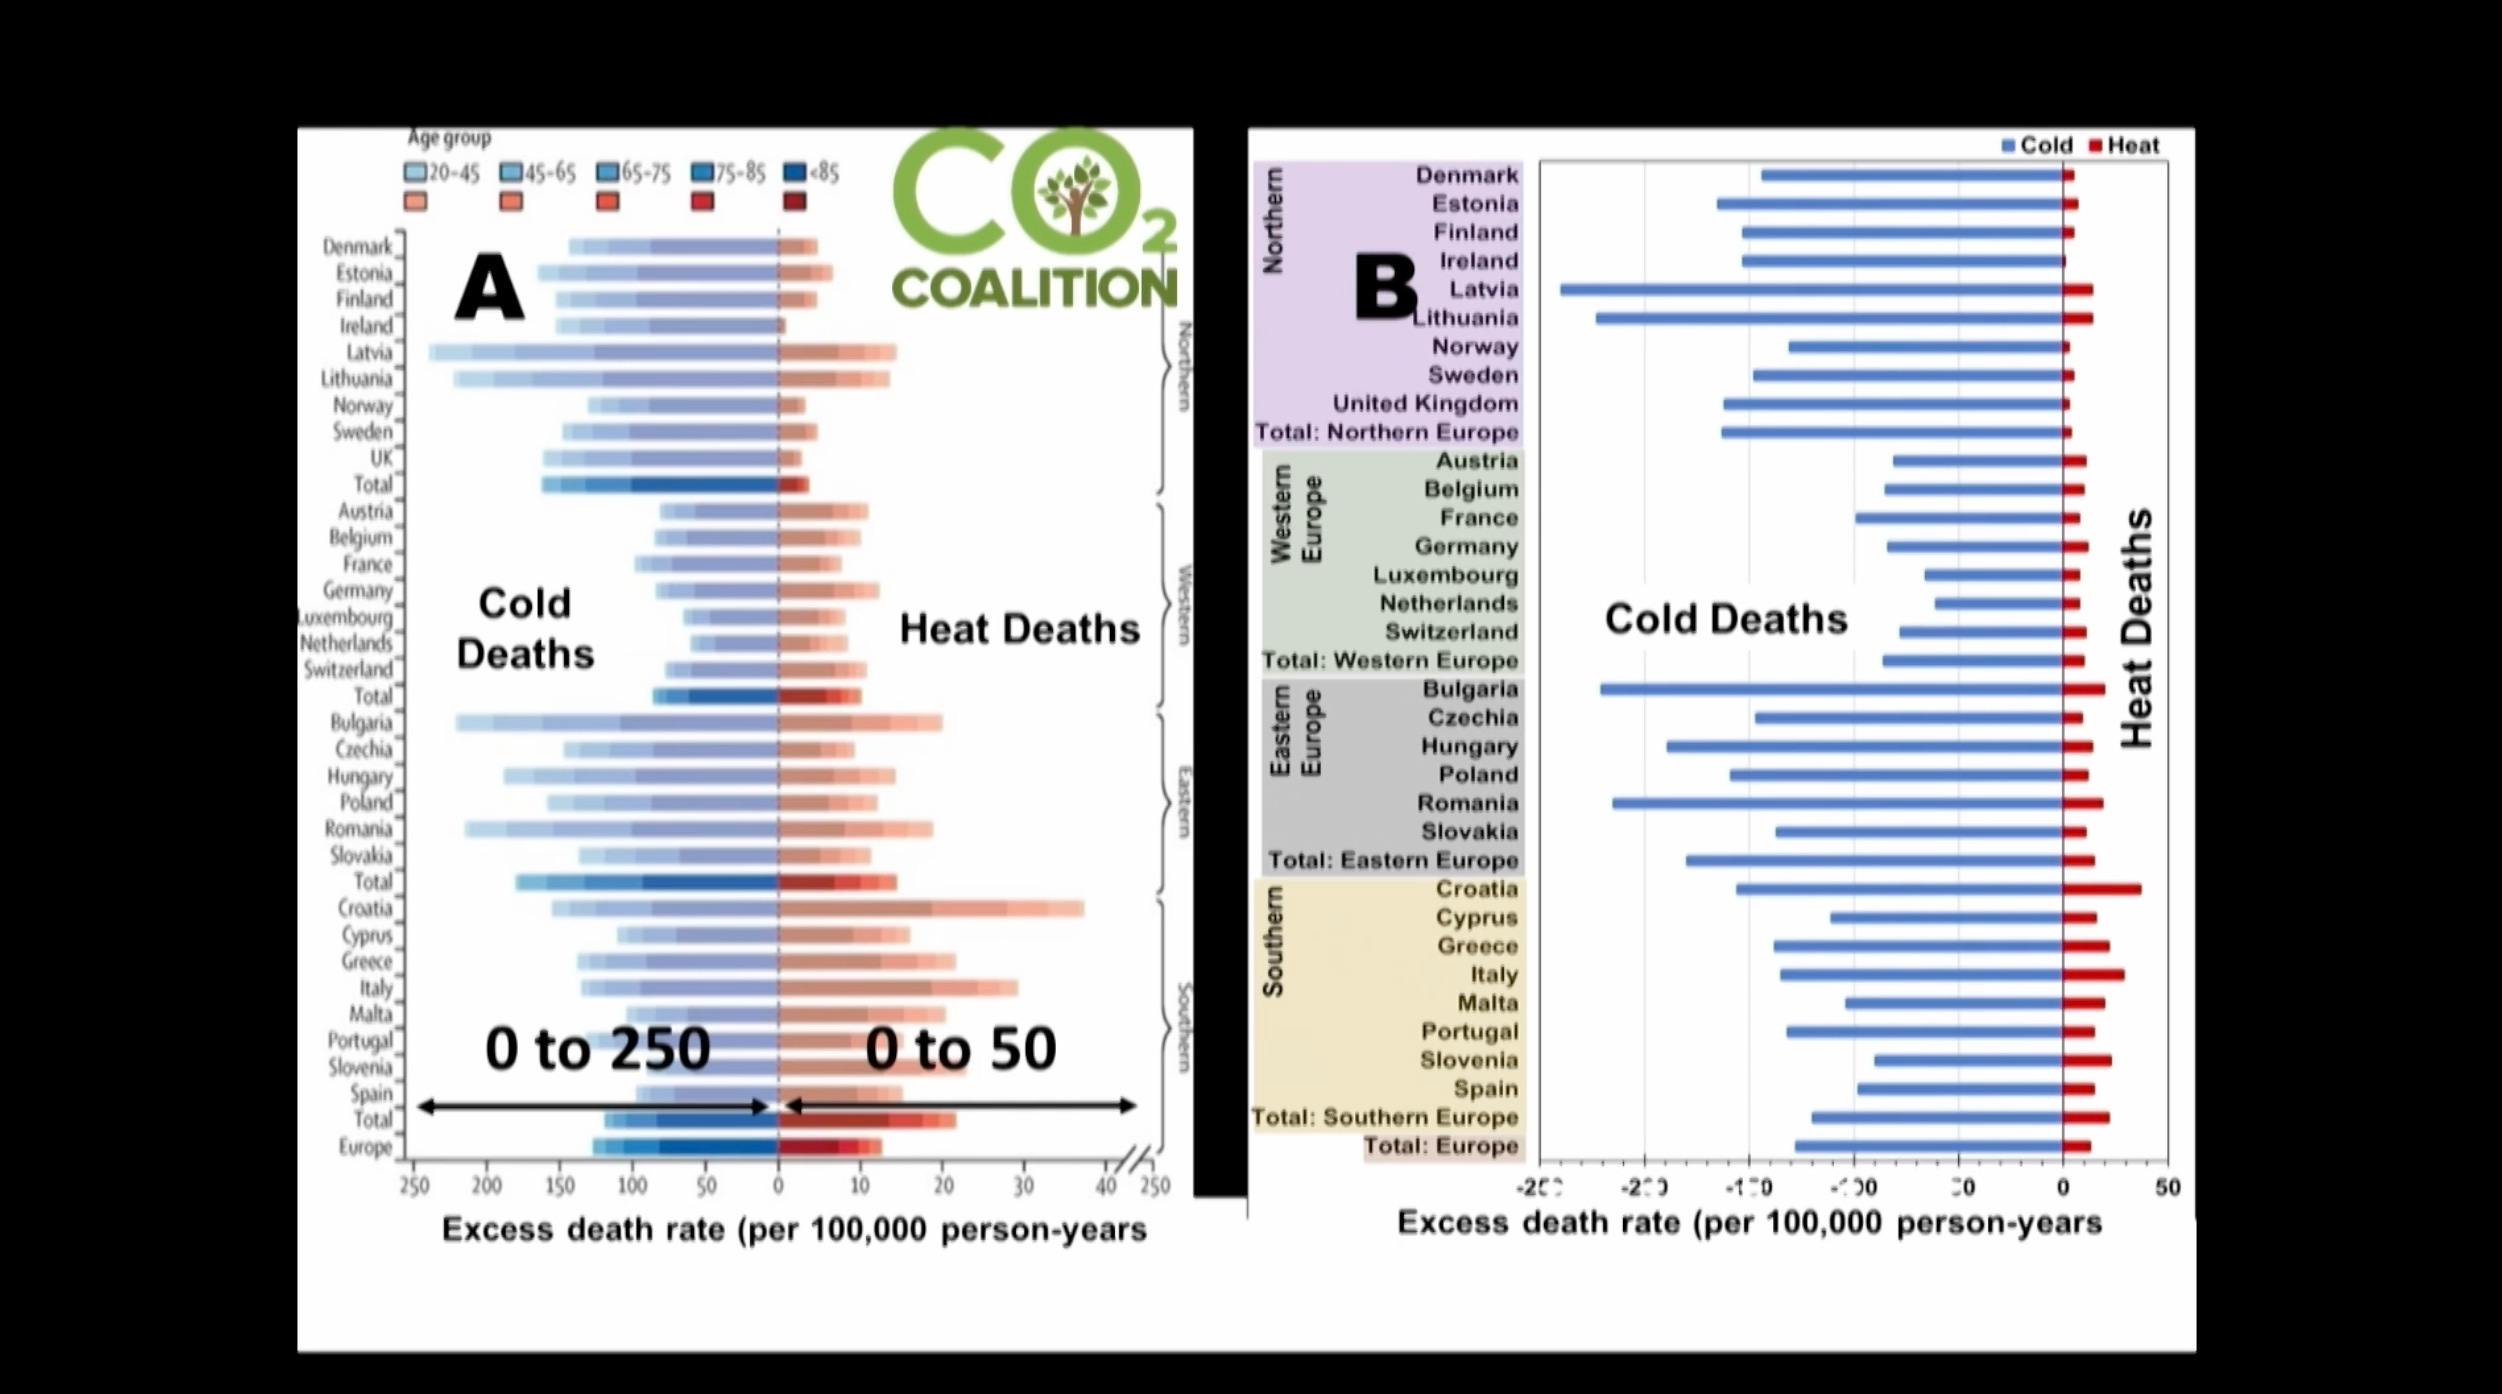
That’s what the actual data should have looked like, and this is what they published. That’s called scientific malfeasance. It should have been retracted. We called and wrote to The Lancet that they have it retracted, of course we heard nothing back. Again, they’re not telling you this. I see things like this all the time. I was the only one that found it. It’s easy to miss that.
You’re being told that natural disasters and deaths from natural disasters are increasing, and they’re not. They’re decreasing significantly. We’ve seen nearly a 98-percent decrease in deaths from natural disasters. Now a lot of that has to do with better infrastructure, better warning. “There’s a category five hurricane that’s going to hit Galveston in three days. You better get out of there.” Well, they didn’t have that back in 1918. And so part of this is warning systems. With Doppler radar, “There’s a bad tornado coming, get to the basement.” And so part of that infrastructure has a lot to do with building better-quality homes that can withstand earthquakes. But again, it’s completely different from what we’re being told. And a lot of these charts are in the book here. And we know for sure the most destructive hurricanes are the F3, F4, F5, or excuse me, tornadoes.
And they have definitely been in decline over the last several decades. There’s a lot of discussion why that is. But it doesn’t really matter why it is. They are declining. And the United States by far, something like 90 percent, 92 percent of all tornadoes in the world occur here in the United States. That’s because we’ve got this unique geography. Tornadoes are created when we have warm moist air overridden by cold air. And we get that with the warm moist air coming up from the Gulf Coast. We’ve got the Canadian air coming in, coming in over the Rockies over top, and that starts the tornadoes. You get this violent—and it’s not hot temperatures that drive … Increasing heat does not create severe weather. It’s the temperature differentials. It’s really hot weather that’s fighting against the really cold weather.
Landfalling hurricanes by decade is also in a slight decline, definitely not increasing. I live in Tampa. When I moved there, they said, “Don’t worry about hurricanes. Tampa hasn’t been hit by a hurricane in 100 years.” Well, we got hit two years ago. We had two of them, Helene and Milton. And so people have always asked me, “What’s going to go on?” And there’s a quote from Yogi Berra that I like, that if you know Yogi Berra, he said, “Making predictions is really tough, especially about the future.” That’s classic Yogi Berra. So people in Tampa are going, “What are we going to do?”
If you remember the movie, The World According to Garp. Garp was terrified. This was Robin Williams at the start. He was terrified. He wanted to buy a house, but he was terrified that a plane would fly into his home. So he was looking at a home and he was standing outside, and as they’re looking at the home, a plane came and flew straight into the house. And he says, “I’ll take it. “ Because he says, “What are the odds of it happening again?” That’s what I tell people in Tampa, “We didn’t get for 100 years. We got hit twice. We can go for another 200 years. We’re good.”
It doesn’t look that way. And then fires, you know about fires here in Oregon and you’re being told that they’re increasing and it’s our fault because of CO₂. And the fourth National Climate Assessment, this is what they listed, this burned area of fires. It looks like it was terribly increasing, but they didn’t source it. Well, I found the source, and this is the full data set, the red. It goes back to 1926. They cherrypicked the data from 1983 and then blew it up to make it look terrible. And it’s true. 1983, we’ve had a slight increase since 1983.
What happened in 1983 is when the Clinton administration started, remember the spotted owl, “We’re going to stop logging.” It was in the mid-eighties when we stopped and changed our forest management in the United States. And it’s the forest management that’s been responsible for some of these intense fires that we’ve seen. We’re all very familiar with that. I’m preaching to the choir. (MAA: 1983 is when the greening effect started.)
Yes. Why did they start the graph in 1983, you might ask? 1983 had the lowest both number of fires and acreage burns. So if you’re going to make it look bad, start it in 1983. And that’s what they did.
This is the Canadian fire service. This is global fires. The orange, this is acreage burn again. It’s been declining. CO₂ is increasing. The Copernicus Satellite went up in 2003. Now we have really, really accurate measurements of area burned globally, and we can see that’s also declining. And sea level rise, you remember we talked about glacier retreat. Glacier retreat and sea level rise go hand in hand. And just like glacial retreat, we see that sea level started rising again in the early 1800s, long before we started adding CO₂.
I had a copy of Chloe the Clownfish Sleeps Well. Our newest book is called Foxy: The Fruit Bat Sleeps Well. And it’s based in the Maldives. And Foxy can’t sleep because she was told at school that her home and her family were in great danger from sea level rise.
And so we’re able to tell the story about what’s actually going on in Maldives. And the Maldives, according to the United Nations, is the most at risk of all the islands and nations in the world because of sea level rise. Okay. 18,000 years ago, the Maldives were also just above sea level. In the last 18,000 years, sea level has risen 400 feet. Why, you might ask, are those islands not under 400 feet of water? Good question. And the answer is, it’s a geologic process known as accretion. These islands actually grow.
The volcanic islands can—that’s easy to figure out because every time volcano erupts—but the other islands, they’re ringed with coral atolls. Coral grows really fast, can keep up with sea level rise, but then the corals are also turned into sand and gravels by storms. Actually, 80 percent of the sands on these islands are from parrot ... It’s parrot fish poop. The parrot fish actually eat the corals, and they digest the polyps out. And then so it goes in one end, and it goes out the other end as sand. My grandson loved that because it’s in the book. Twelve-year-old boys love that. And so these sands and gravels during storms come washed up onto the island, winds distribute it, critters move it around the island. It’s a slow process, but geology is a slow process, and sea level’s only rising seven inches per century, so it doesn’t have to. And so again, 400 feet of sea level rise, and here we are. They’re still about the same as what they were 18,000 years ago.
(MAA: I remember hearing about twenty years ago that Tuvalu was going to be underwater in twenty years.)
There’s a famous picture of the prime minister of Tuvalu standing hip-deep in water with his hands out. He wants climate reparations, doesn’t he? I can’t blame him. I’d be doing it, too. He wants billions of dollars in climate reparations.
And so also there are fourteen resort complexes and four airports being constructed now in the Maldives. And so they’re being funded by equity and insurance companies. Multinational insurance companies avoid risk like the plague, do they not? Why would they be insuring tens or hundreds of millions of dollars of projects in the Maldives if they’re only going to be underwater in a few years? Right. The answer is they wouldn’t.
The other thing we look at here, probably the greatest benefit of warming and more CO₂ is increase in vegetation, particularly crop productivity. We see NASA shows just a tremendous increase in vegetation. Again, all this increased CO₂ is just fueling vegetation growth. And also the other benefit is that crops are better able to resist drought because they don’t need to breathe in and out. It’s called respiration. Since they’re not doing that as much, they’re not losing water, and they don’t need as much water. So they’re better able to resist drought. And that’s why we’re seeing deserts are actually shrinking because of that. The Sahel—200,000 square miles of the Southern Sahara—are now grassland that were just forty years ago desert. And that’s a good thing.
We’ll look here at, again, crop productivity. This is a key item here. If we care about population, if we care about society, what we find out here is that crop productivity increases is outpacing population growth. We’ve had these Malthusian ideas that we need to get rid of. Yes. What they’re doing with these climate alarmists and the people promoting this is really an antihuman philosophy. They want fewer people. “Well, you go first!”
(MAA: Yes. I call them philanthropaths.)
And there’s some, too, in the Christian community, we’ve got people that are saying, “Well, what would Jesus do? How can you be a Christian and not care about the earth?” Well, we do care about people because human flourishing—it allows us with fossil fuels and more carbon oxide, more crop productivity. We’ve now got eight billion people on earth that we’re able to feed. Famine has turned into almost nonexistent event.
These are the four of the top crops on earth: rice, wheat, sugar cane, and corn. And just look at this. Again, the blue is CO₂, the black is the crop productivity, so they’re marching in lockstep as CO₂ is increasing. And it’s not just because—there are technological advances. And also the warming again has a lot to do with this because we’re having greater growing seasons.
This is American corn production. It’s black, red is temperature, and this blue line here is CO₂. And again, we’re breaking records year after year after year of crop, corn production in the United States. That’s a really good thing.
One of my favorite topics, and I’ve got a whole section of the book here, is the strong relationship between human history and climate history. And we see that the warm periods have always been just wonderful—huge, huge productivity of food, life was good. It was cold periods that were just horrifically bad. And so each time we saw, when it started getting cold, we’d have crop failure, famine, pestilence, and mass depopulation.
If you were going to be Empress Cathy, you’d want to be an Empress Cathy in a warm period because you could feed your subjects and everybody would be happy, fed, well-fed. They would love Empress Cathy. I think you make a good empress, by the way. But you would not want to be Empress Cathy when it started getting cold because then all of a sudden you can’t feed your subjects. They’re going to get angry. They come after you with the pitchforks, and that’s what we saw. We saw collapse of civilizations. The first was, it was called the late Bronze Age Collapse. It started getting cold pretty quickly, and all these great civilizations within fifty or a hundred years collapsed—the Minoans, the Babylonians, the Hittites, the Assyrians, all of them. The only big civilization that barely survived was the ancient Egyptian civilization, but they just hung on by a thread. So we see that time after time.
Also in the book here, I’ve got a great chart of during the Medieval Warm or the Little Ice Age, which was the last cold period, they had huge witch hunts because there were thousands of witches killed— “witches,” within air quotes.
I’ve got a chart. What they did was they said when crops are failing, something’s causing it—it’s the witches that are doing it, and so they started killing the witches. And I’ve got a chart there. I compared number of witches killed per decade to temperatures, and there was a great correlation. So it’s kind of funny, unless you happen to be accused of being a witch.
One of the things I’m really proud of, our members came to me and said, “We’re really concerned about the state of science education in America. Our grandchildren and children and great-grandchildren are being indoctrinated into the climate cult. They’re being taught consensus science and groupthink. They’re not being taught the scientific method. They’re not being taught critical thinking skills. We want to do something about it.”
And we have. It’s impressive what they’ve accomplished, our education committees. And if you look in the book and look at the education committee qualifications, these guys are—it’s PhD, not just guys, but PhDs in chemistry, physics, nuclear physics. They’re highly qualified. This is the latest book, Chloe the Clownfish Sleeps Well. So Simon, The Solar-Powered Cat, one of their favorites of the kids. It’s about photosynthesis.
Our senior education advisor is Dr. Sharon Camp. She’s got a PhD in chemistry. She taught AP science. She was a reader for AP science standards. She actually was a scientist, and so few science teachers are scientists. They’re education managers, not scientists. She does all of our lesson plans. So we’re catering to the homeschool community and the charter schools. We’ve delivered some of our materials at Logos, and they liked it.
I’m really proud of this, what we’ve been doing. We go to a lot of climate conferences. We did six last year. We’re going to do five this year. And they love what we’re doing and we’ve a great outreach for that. We also attend conferences. We went to the National Science Teacher Association annual meeting and had a big double booth. We went to the Belly of the Beast. We researched and published a report that was called Challenging the National Science Teaching Association’s Position Statement on Climate Change. We published it, and they didn’t like it at all. And they came down on the second day of the event, they came down, the CFO and another top dog, and they visited us, and they told us, “You need to remove your materials. This is our convention.” I told them, “Go pound salt.” I said, “We’re not taking them down.” He said, “You have to. “ And I said, “Well, I’m not going to.” “So then you need to leave.” They kicked us out. And bear in mind, the ladies on the left both have PhDs in analytic and regular chemistry. They’re probably the only two PhD scientists in the entire building, and they kicked us out, and that’s what they do, is they need to silence us. And they’re very good at it. But hopefully, that’s turning around now. I just feel it really, and you see it almost every day.
The lady on the right there is Angela Wheeler. I just announced yesterday that I’m stepping down as executive director, and she’s replacing me. And so I’m staying with the Coalition as a senior fellow. I’ll be doing the fun stuff like this, and she can have all the headaches, but she’s wonderful. She’ll do a great job leading us, but it’s a big change for me, and I like it.
And big news, big news. This Sunday—Newsmax came to me and they said, “We’re doing a documentary.” And they created a documentary, Unsettled. And it is Chris Wright, Department of Energy, John Clauser, Will Happer, chairman of the CO₂ Coalition, Steve Koonin, and Greg Wrightstone. I have no idea how they got me there. There’ll be the five of us in this documentary, Sunday night at 6:00 pm Pacific time. Please tune in.
[Plays two sixty-second ads that will run during the documentary.]
Q&A
Do you have any thoughts about the longer interglacial periods?
We’re nearing the end of our current interglacial period. We just are. And we’re going at some point to go into the next cold period, glacial advance, and it’s going to happen. Maybe it’s already started, and we don’t know it yet. Maybe it’ll be in 200 years. It might be in 1,500 years. Remember my Yogi Berra quote, it’s hard to predict. And so I can’t tell you when it will be, but when it does come, it will be horrific. It will be horrific because we know what happened during the last events. I mean, virtually all of Canada, Canada was under a thousand-plus feet of ice, like Boston. It’s going to be horrifically bad.
This isn’t exactly CO₂-related, but there’s been a big discussion on the impact of bovine-produced methane. And the policy side of that is having a big impact on ranchers and dairy. Is that something you can speak to?
If you Google my name and John Stossel, just two weeks ago, John Stossel had me up to New York City. I sat down with their crew, and we did a TV section on beef and methane and global warming. So it’s very timely. What the allegation is—methane is a greenhouse gas, and they claim in each molecule of methane’s about thirty times as potent warming as CO₂, and they blow that up.

But CO₂ is ten times as much. If you look at the numbers, methane has about 10 percent as much warming potential as CO₂ in the end because there’s just so much more CO₂. Methane is measured in one part, or it’s in parts per billion, and CO₂ is in parts per million. And so there’s a lot of mistakes, people like AOC—“Well, the cows are flatulating and they’re farting.” That’s not where the methane’s coming from. These are ruminants. They’re called ruminants because they eat grass because grass is worthless except for those that can consume it. Ruminants—deer, buffalo, sheep, cattle, they can eat grass, and they’ve got the multiple stomachs, and one of the stomachs has no oxygen, is oxygen-free. And it’s a fermentation process that they can digest the grass. It’s the cellulose that they can digest.
You and I can’t digest cellulose. Most animals can’t digest cellulose, and it’s that process of digesting and fermenting the cellulose and turning it into useful things like a ribeye. So we can. They’re belching. And so it’s actually coming out the front end, not the back end.
So is bovine-produced methane a significant source of climate impact?
It’s near zero. Near zero. We’ve got those numbers. If you go to our website and type in “methane,” we have some really, really, really good information on methane and its “warming potential.” And probably there’s a good argument that it’s because the cattle graze and their prairies really need—like the buffalo. Just think about this. In 1800, there were about the same number of buffalo as there are cattle in North America. Well, the buffalo were belching methane just as much as the cattle, probably more, but that was all natural, right? But now we’ve got human-raised cattle, and that’s bad. And so think about that. So there’s buffalo work, too. No, go ahead and have that ribeye.
Just a comment. In Ashland, there’s a lot of places that have ancient pictures of Ashland on the walls, and all the hills around Ashland are completely naked in the 1800s when the white people first got there because it was a dry period. There was no forest.
And also if you look at those pictures of the 1800s, there were stands of trees. And if you look closely, the trees that are in those stands, the first limbs are maybe twenty feet up in the air. Why was that? Because they had grass fires that came through. So the grass fires came through and they burned the low roots, but they weren’t so intense because you don’t have that fuel to burn it. And so the grass fires, these were regular grass fires that came through, but because they were grass fires, they weren’t as intense.
As far as who started the whole global warming movement, I mean, I know Al Gore, right? But who’s the who and the why?
Well, we can trace it. A lot of people trace back to 1988, James Hansen, there was a Senate hearing and what they did is interesting. They went and they said, “What’s the hottest day of the year historically?” And it was like August 12 or whatever day it was. So they held their hearing, and lo and behold, it was a pretty hot day. The night before, they went in, turned the air conditioning off and opened the windows up. So the people got in the next morning, and it was sweltering, and they’re talking about global warming, and they got up and they said, “Have any of you ever been in a Senate office that’s been this hot in this room?” And it was all staged.
You asked me why are they doing it? I don’t know because I can’t look inside men’s and women’s souls and judge their motivation why they’re doing it. But as a scientist, I can tell you this is what they’re telling you. And here’s what the facts are. That’s my job. Why they’re doing it, I don’t know. But we know they are lying to you.
MAA: I think I know.
Enlighten me.
MAA: I actually published a piece yesterday called Losing My Religion where I referenced Gregory’s research, but toward the end, I postulate about why they are propagating this climate narrative. And I believe it is because institutions like the United Nations, their entire Agenda 21, Sustainable Development Goals, Agenda 2050, everything about that depends on the public buying into this climate change alarmism. And they’re shifting the responsibility from corporations and talking about the environmental movement got hijacked to focus on people and this whole religion of guilt and pain, basically being able to offset our carbon footprints, all that. But we are essentially being corralled into a totalitarian one-world system of servitude. And in order to convince people to do that, you need them to believe a myth like this so they’ll give up all of their conveniences, and they will think their virtue-signaling and they’re basically tapping into people’s compassion and empathy and desire to do good. They don’t realize they’re being psychologically manipulated into their own enslavement.
I try and stay out of the politics because we’re scientists, but I’ve heard a lot of people talk about it. It’s the perfect thing to use to bring down Western civilization, capitalism, to impose this one world government on us. But I didn’t say that. (laughter)
When you present these facts and this information, does the other side acknowledge it? If they do, how do they respond?
You might be surprised. I don’t get a lot of pushback because I’m presenting facts that are hard to dispute. I expose their lies. And they want to just ignore me. They want to ignore us, and maybe we’ll just go away. Well, we’re not. And things like this, again, this documentary Sunday. There’s a lot of things coming out now. We want to stick with the science. And I think we are well-suited from our group to do that. There are other groups in the climate change arena that are a lot more activists, that are a lot more political, and that’s just not who we are. And they get attacked more because they are doing that.
Do they acknowledge that you have the scientific ability to do this? The other groups?
They’ll never admit that. Oh my God, no. No. No, no, no. They can’t acknowledge that. They can’t allow us to speak. I tell a pretty convincing, compelling story that’s fact-based. It’s hard to dispute what you just saw tonight because it’s all factual, and they have to ignore it. They can’t. And that’s why there’s never a debate because they say, “The science is settled.” Because there’s nothing to debate. “If we debate you, then we’re acknowledging that the science isn’t settled.” Well, it isn’t.
Rob Schläpfer1: There’s a great book called In Search of the Catastrophe Signal. It’s an academic book that traces the origins of the IPCC. It’s written from a very academic, straightforward objective. And it shows how the organizations that came together to deal with this ozone crisis in the mid-eighties and the Reagan administration, how that kind of morphed into the IPCC with some actors who obviously had some political agendas. But the point of the book is that this is driven by motivated reasoning. They had an end that they wanted, and they found “science.” They solicited scientists who would find the answers that they were looking for. So it’s a great example of motivated reasoning.
Talk about Michael Mann. Michael Mann was the scientist that did the hockey stick. It was 900 years of slow cooling and then the beginning of the twentieth century. He’s very, very, very litigious. He sued Dr. Tim Ball from Canada for libel or malice, whatever it was, because Tim Ball said—Michael Mann was a Penn State—he said that Michael Mann should not be at Penn State. He should be in the state pen.
Pretty funny. That’s a good one. But Michael Mann sued him for millions of dollars. And it went for many, many years. There was a judgment, and then it was finally overturned, and Michael Mann now owes—Tim Ball died, though. And it just wore him out. And so Michael Mann, he still owes the family of Tim Ball a lot of money, so he can’t cross the Canadian line because he’ll be arrested. But anyhow, the point of this is my next book is already written, and my wife has told me I’m going to have to find a new wife if I publish it because he’s really, really, really litigious. And he sued Mark Steyn, the acerbic Canadian commentator, and it was bad. So the title of the book is Michael Mann and His Disciples of Disinformation. I’ve got a great cover, and it’s a takeoff of The Last Supper where Michael Mann’s with this golden hockey stick and all these—Greta Thunberg and Al Gore, and they’re all [praying]. It’s a takeoff of Last Supper, and it’s really good.
Well thank you all very much.
Note: I did some cleanup of the transcript for clarity and flow along with inserting relevant links.
© Margaret Anna Alice, LLC


🚀 You Fuel This Work 🙏
Your subscriptions and donations sustain me. I cannot do this work without your support.
Because of you, I can fulfill my life’s purpose to help others.
The only reason I can spend every possible second writing, researching, producing videos, collaborating, nurturing our karass, living my cheng, and battling tyranny is because of the 0.98 percent of you who are kind enough to support me. Thank you with all of my being for that tangible expression of your appreciation for my work.
When you subscribe, you get to participate in monthly Karass Konnections video calls. You also gain access to premium content like Memes by Themes, Elucidating Excerpts, Consequential Quotes, Case in Point, Afterthoughts, Behind the Scenes, podcasts, personal writings, and bonus articles.
Thank you, dear readers, for helping our thirteen kitties and me survive 😸
🎁 Personal Gift
If you would like to snail-mail me a tax-free personal gift, please DM me on Substack or reply to any of my newsletters for details.
😇 Become a Founding Member
If you take the extraordinary step of becoming a Founding Member, you will enjoy benefits such as:
signed & personalized copy of Canary in a Covid World—your choice of Volume 1 or Volume 2
Audible audiobook of the first Canary volume ($21 value) while supplies last
special gifts
select typeset PDFs
Zoom or phone call, depending on your preference
Karass Korner (coming soon)
I especially want to thank those of you who have taken the time to write a private message to me when you subscribe. I read and cherish each note.
Thank you for being part of our karass of brave, brilliant, kind, and witty thinkers.
🙏 Shoutouts Gratitude

🌎 Don’t Miss the World Council for Health’s Better Way Conference!

📆 Save the Dates: May 29–31, 2026
Rhode Island • Speakers
Gala Dinner: Friday, May 29, 2026 (evening)
Conference Dates: May 30–31, 2026
Cancer Workshop: May 31 (during lunch break)
💸 Get 10-percent off with basket code LAWRIE10
You can still get tickets for the upcoming Better Way Conference in Rhode Island! I will be there and hope to see you, too.
🗽 NY Fundraiser for Rebecca Charles
After the Better Way Conference, I plan to spend the following week in New York visiting with dear friends like Vera Sharav. I will be attending the cocktail hour for a special fundraising event on behalf of Rebecca Charles Jackson, whose beautiful special daughter Danielle was hospicided on October 6, 2021. The Free Now Foundation has bravely taken on Rebecca’s case, and they need your support to fight this noble battle.
If you know any large donors who can afford this special event, please encourage them to attend.
Danielle’s Justice Fundraiser Dinner with Vera Sharav
June 6, 2026 • 7:30–10:30 pm • West Village, Manhattan • Tickets


I know most people (including myself!) cannot afford the tickets to this exclusive event, but you can always support Rebecca’s case here.
🛒 Spread the Words
If you would like to help propagate the message that Mistakes Were NOT Made, you will find a wide selection of products in this collection.

📖 SAVE on Signed Copies of My Fairy Tale Book!

I am currently running a sale on signed, personalized copies of my fairy tale, so now is the time to buy copies for yourself and as gifts. Message me on Substack or reply to any of my newsletters to place an order.


📚 Anthologies
Canary in a (Post) COVID World: Money, Fear, & Power (Hardback, Paperback, Kindle)
Canary in a Covid World: How Propaganda & Censorship Changed Our (My) World (Paperback, Kindle, Audiobook)
Yankee Doodle Soup for the Fringy, Tin Foil Hat–Wearing Conspiracy Theorist’s Soul (If you enter the code ALICE at checkout, Jenna will give me a royalty 🙏)
🐇 Follow Me on Social Media

⏰ Wake-up Toolkit
My Wake-up Toolkit is a great way to get acquainted with my content. I’ve organized my articles by topic for easy reference and use in your red-pilling efforts as needed. Note that I have not been able to update this since June 2024 due to a technical issue, so check my archive for more recent additions.

🌟 WARM GRATITUDE FOR THE RECS!
The single-most important driver for new readers joining my mailing list is Substack Recommendations. I want to thank every one of you who feels enthusiastic enough about my Substack to recommend it, and I especially appreciate those of you who go the extra mile to write a blurb!
Remember, a subscription to Margaret Anna Alice Through the Looking Glass makes for an intellectually adventurous gift down the rabbit-hole!


Note: Purchasing any items using Amazon affiliate links included in my content will further support my efforts to unmask tyranny.
Credit for filming this presentation goes to Rob Schläpfer, creator of the Oregon Education Project.


